Remote rendering and graphics for network systems Applications
Author: Manyu Tang
email: mtang@kent.edu
Prepared for Prof. Javed I. Khan
Department of Computer Science, Kent State University
Date: November 2003
Abstract: Knowledge developed from the network has made two big
contributions to computer graphics: Providing a huge computation
power by
using a cluster of computers as a computing resource and Enable remote
rendering
by using network as a communication infrastructure. In this
survey we
first introduce the basics about computer rendering and followed by
usage of
network in the computer rendering. Finally, we conclude survey by
presenting
existing problem of combining network and rendering and current
solutions to
them.
Other
Survey's on Internetwork-based Applications
Back to Javed I. Khan's Home
Page
Table of Contents:
Introduction:
What is Computer rendering
Computer rendering can arguably be defined as the process of creating
pictures
using computer by extracting useful information from a dataset.
Following
the fast development of computer technology, the applications of
computer
rendering
has moved from dealing with 2D images to 3D images. The
main
applications categories include: Computer Aided Design,
Scientific
Visualization, and Computer Animation and Computer Games.
The common question to the computer rendering is the difference
between
displaying a digitized picture and rendering a dataset. The
digitized
picture, for instance, from a digital camera, is actually a file
which
contains a dataset for a 2D image whose size is about 1 or 2 MB.
The
operations we can perform on are simple such as rotating, enlarge and
reducing
image. Computer rendering usually copes with a large dataset
whose size of
100 MB is not unusual. The operations on the dataset is very
complicated. They usually require advanced mathematic theory,
fast
processors and a long time.
Additionally, the job of computer rendering is not only to display
a
image of the a dataset but also manipulate the dataset by applying
different
algorithms to solve a various problem. For example, in a building
3D
dataset we can see the outside of building. We can also let
computer take
off the roof and see the inside of the building such as the arrangement
of the
rooms. We can even transparent the wall of
the building to see how
many
cables buried inside. Overall, computer rendering is a very
advanced topic
and it has been widely used as a tool in many different scientific
research
areas.
The general rendering methods
Computer rendering is a very complicated task which involves nearly
every
aspects of computer software and hardware back up by the high level
mathematic
theory. Generally, there are following methods to accomplish the
rendering
process. But, most of the time, those methods need to be
integrated
together in order to achieve the best rendering result.
- Painter's method: It works as a simple-minded painter who paints
the distant parts of a scene at first and then covers them by those
parts which are nearer. Formally, it first sorts all the polygons
which are one of the basic rendering primitives by their depth and then
rasterizes them in this order. The invisible polygon will be
rendered underneath the visible polygon and thus solve the visibility
problem. This method has one problem when there are three or more
polygons overlapped with each other. Then, some other methods
need to be applied to fix this problem.
- Ray tracing method: It works by tracing the path taken by a
ray of light through the scene, and calculating reflection, refraction,
or absorption of the ray whenever it intersects and object in the
world. Since it simulates the real effect such as reflection and
shadows to produce a scene, it is most popular method used to do the
rendering job.
- Global illumination method: It renders a scene
according to the light falling on a rendered object. The light is
taken into account not only the light which has taken a path directly
from a light source( local illumination) but also light which has
undergone reflection from other surfaces in the world. Hence, the
images rendered using global illumination method are often considered
to be more photorealistic than images rendered by the other methods.
- Radiosity method: It is developed from the theory of
thermal radiation by relying on computing the amount of light
energy transferred between two surfaces. Since the effects
produced is very subtle in this way, it helps to create the illusion of
realism.
- Scanline method: It works on a point-by-point basis rather that
polygon-by-polygon basis. Some point in a line is calculated,
followed by successive points in the line. When the line is
finished, rendering proceeds to the next line. The main advantage
of this method is that it is not necessary to translate the coordinates
of all vertices from the main memory into the working memory area,
cache memory, each time a new polygon is encountered. Hence, it
can provide a substantial speed-up.
- Z-buffering method: It stores the depth of a
generated pixel according to its z coordinate in a buffer which is
referred z-buffer and usually arranged as a two-dimensional array
(x-y), one element for each screen pixel. If two pixels have the
same x-y coordinates, only the one that is closer to the observer will
be rendered. Hence, the z-buffer will allow the graphics card to
correctly reproduce the usual depth perception: a close object hides a
farther one.
The rendering pipeline
The goal of computer rendering is to produce a useful scene from a
dataset. Such a task is often inherently interactive and
iterative: one
can not expect to accomplish it by simply pushing a large dataset into
a black
box. Suppose that we have a set of vertices that defines a set of
primitives. Because the usual representation is given in terms of
locations in space, we can refer to the set of primitive types and
vertices as
the geometry of the data. In a complex scene, there may be
thousands or
even millions of vertices that define the objects. We must
process all
these vertices in a similar manner to form and image in the frame
buffer.
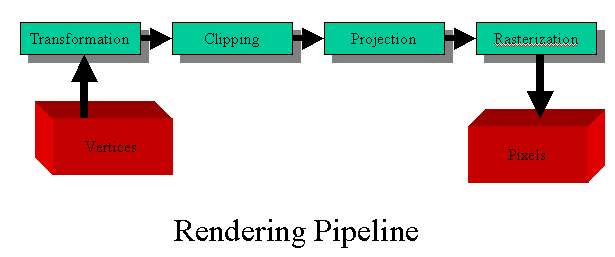
If we think in terms of processing the geometry of our objects to
obtain
an image, we employ the following block diagram which shows the four
major steps
in the rendering process.

Transformation
Many of
the steps in the image process can be viewed as transformations between
representations of objects in different coordinate system. Some
vertex
data (for example, spatial coordinates) are transformed by 4 x 4
floating-point
matrices. Spatial coordinates are projected from a position in the 3D
world to a
position on a screen. If advanced features are enabled, this
stage is even
busier. If texturing is used, texture coordinates may be generated and
transformed here. If lighting is enabled, the lighting calculations are
performed using the transformed vertex, surface normal, light source
position,
material properties, and other lighting information to produce a color
value.
Clipping
Clipping,
a major part of primitive assembly, is the
elimination of portions of geometry which fall outside a half-space,
defined by
a plane. Point clipping simply passes or rejects vertices; line or
polygon
clipping can add additional vertices depending upon how the line or
polygon is
clipped. The results of this stage are complete geometric
primitives,
which are the transformed and clipped vertices with related color,
depth, and
sometimes texture-coordinate values and guidelines for the
rasterization step.
Projection
In
general, three-dimension objects are kept in three dimensions as long
as
possible, as they pas through the pipeline. Eventually, after
multiple
stages of transformation and clipping, the geometry of the remaining
primitives
(those that have not been clipped out and will appear in the image)
must be
projected into two-dimensional space.
Rasterization
Rasterization
is the conversion of both geometric and
pixel data into fragments. Each fragment square corresponds to a pixel
in the
framebuffer. Line and polygon stipples, line width, point size, shading
model,
and coverage calculations to support antialiasing are taken into
consideration
as vertices are connected into lines or the interior pixels are
calculated for a
filled polygon. Color and depth values are assigned for each fragment
square.
Networks and rendering
Network based parallel computing backend has been applied to the
computer
rendering since long time ago. One difficulty of computer
rendering is
that it requires a tremendous computing resource. Usually, a standalone
computer
is not powerful to absorb all the computation required within a
reasonable
time. With the advanced network technology and reducing cost of
personal
computer, using a group of computers as a computing resource becomes a
more and
more attractive resolution. In addition, the multiple computers
have also
been used as the final rendering device for the large scene.
Only lately, the remote rendering became an interesting topic.
As we
mentioned early, computer rendering requires high computing power to
result a
huge final dataset for the rendering. Plus, the rendering
application is usually interactive oriented and every interaction
requires a new
computation and result a new dataset. As remote rendering stands
that the
dataset and rendering device do not exist at the same place. If
we
rendering
an object via the Internet, physical distance between the rendering
device and
computed dataset could be ten thousands away from each other. Thus,
remote
rendering is groundless without high bandwidth network's support.
Only
recently, the development of the network technology has fulfilled the
such
requirement. However, huge dataset and frequent data transmission
are
still the bottle neck for the remote network performance.
In this survey we will discuss the above two aspects about computer
rendering
on the network systems, mainly focusing on the research activities in
these two
fields and their progress. The next section will be given quite
details on
the current development of the network based computer rendering.
Then, we
will talk about the problems in the network based rendering and how to
overcome. Finally, a set of useful web reference will be given
for the
interesting reader for the further research.
Network Aided Rendering
Cluster based rendering
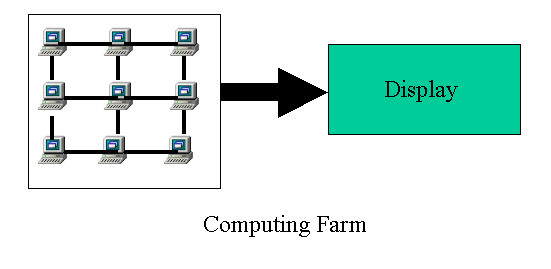
Computing farm

As we mentioned it early, the computer rendering is an intensive
computing
process which often exceeds the single computer's computation
power. Using
a cluster or a group of computers as a single computing source can be
attractive
approach to solve this problem. Over here, we define a cluster as
a
collection of interconnected computers used as a single, unified
computing
resource via some form of network. Though clusters which are
generally
expected
to be connected by a local area network, they could also be connected
by a wide
area network such as Internet. Clusters are usually inexpensive
to build
since they can be assembled using conventional personal computer
technology and
freely available software such as a Beowulf cluster.
With computation is actually performed on a cluster, the original
rendering
dataset need to be decomposed to each single computation node in the
cluster.
The decomposition task can be realized by either algorithmic
decomposition
(different parts of the program are run on the same data) or by domain
decomposition (the same program/algorithm is run on different parts of
the
data). Under the cluster computing environment, the processors
usually
divided into two groups:
- Geometry processor: it determines which geometric objects appear
on the display and assigns shades or colors to these objects.
- Rasterization processor: it takes the output from Geometry
processor and determines which pixels should be used to approximate a
line segment between the projected vertices.
According to when to decide which object gets projected eventually
or when to
sort those geometric primitives following their depth, the algorithms
of how to
distribute the original dataset are usually divided as followings,
- sort middle: sort procedure is done between geometry
processors and rasterization processors. This configuration was
popular with high-end graphics workstations a few years ago, when
special hardware was available for each task and there were fast
internal buses to convey information through the sorting step.
- sort last: sort procedure is done after rasterization
processors. This configuration is popular with commodity
computers connected by a standard network.
- sort first: sort procedure is done before the
geometry processor. This configuration is ideally suited for generating
high-resolution display. Suppose that we want to display our
output at a resolution much greater than we can get with typical CRT or
LCD displays that have a resolution in the range of 1-2 million
pixels. Such displays are needed when we wish to examine
high-resolution data that might contain more than 100 million geometric
primitives.
Multi-display rendering

Over the last few years, computer have become faster and more
powerful by
almost all measurement. Computer processor speeds have increased,
memory
has become cheaper, and hard drive sizes have grown. However,
there is one
computer component that has remained largely unchanged. Displays,
such as
standard computer monitors, have remained at a resolution of around one
million
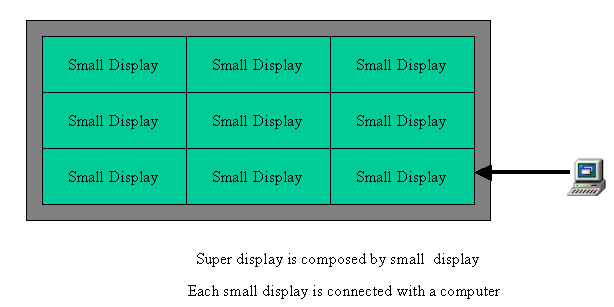
pixels. In order to build a higher resolution display, current
approach is
to combine a group of computers' monitor to make a big display.
And, each
monitor in the group is backed by a computer for rendering only a part
of the
big display. Most of these display fall into one of following
three broad
classes,
- abutted displays: They require that all displays be carefully
aligned so that no pixels overlap. Abutted systems are fairly
common and are used in everything from sports stadium scoreboard to
trade show exhibits. Some examples of abutted displays are CAVE [2],
Office of Real Soon Now" [1], and the display wall system at Lawrence
Livermore National Laboratory [12].
- regular overlap displays: they require displays to be carefully
aligned so that there is some controlled overlap between displays. the
displays are required to have precise geometric relationships that
ensure regularity between overlap regions. The overlap regions
are used to blend imagery across display boundaries. This is done
to help hide both photometric and geometric discontinuities at the
boundaries. Princeton's Scalable Display Wall [6] and Standford's
Interactive Mural [5] are both examples of regular overlap displays.
- rough overlap displays: it is most complex display system
because it allows rough overlap regions between displays. The
only requirement is that displays actually overlap. This means
that overlap regions can be of arbitrary shape and size. At the
cost of its complex design, rough overlap display gives most
flexibilities. UNC's PixelFlex system is an example of this type
of this type of display [3].
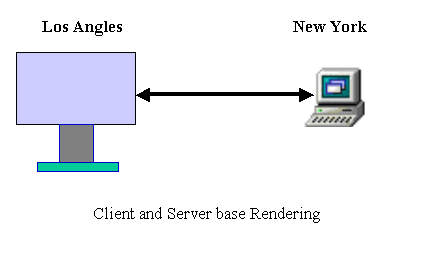
Client and Server based rendering

As we have discussed so far, the rendering device and rendering
dataset
are at the same location. Nevertheless, we might have a situation
where the rendering dataset is at one place and we need to view the
scene from the other
site, especially under the situation of networked multi-user virtual
environments which require that users share a common scene over a
network.
Example include networked walkthroughs of large information spaces
(buildings,
databases, ultimately a 3-D Internet) and interactive applications such
as
immersive cinema, networked games and computer supported cooperative
work.
A virtual environment requires efficient rendering of the
three-dimensional
objects forming the simulated world. In a distributed virtual
environment,
the work is divided between processes. One process will
maintain the
actor database and run the simulation, whereas another is responsible
for
rendering. These processes will often run on separate CPUs or
workstations, which creates the need for rendering. In multi-user
systems,
this is always required, independent of network topology.
Given today's typical hardware setup with high speed CPUs, fast
system buses
and comparatively slow network transmission, it is very reasonable to
assume
that the network is the most constrained resource of the whole
system.
Currently, three distinct models for distributed graphics have been
developed
for the visualization of distributed geometry databases, with overall
goal of
minimizing bandwidth consumption on the network.
- Image-based: Rendering is performed by the sender, and the
resulting stream of pixels is sent over the net (e.g. digital TV, X
pixmaps).
- Immediate-mode drawing: The low-level drawing commands used
by drawing APIs are issued by the application performing the rendering,
not immediately executed, but sent over the network as a kind of remote
procedure call. The actual rendering is then performed by the
remote CPU (e.g. distributed GL[11], PEX in immediate mode [12]).
- Geometry replication: A copy of the geometric
database is stored locally for access by the rendering process.
The database can either be available before application start (kept on
local hard disk, such as seen in computer games like DOOM [13] and
networked simulations such as NPSNET [14], or downloaded just before
usage, such as current VRML browsers do [15].
[other parts of your paper]
Complications with the network:
Load balance on cluster
As the cluster does the computation, the node in the cluster needs
to
communicate with each other to update required dataset which creates a
busy
network traffic and consequently spends a lot of unnecessary CPU
time. In
addition, some nodes might have light computation load while others
have heavy
load to do. Then, nodes will have to wait on the nodes with heavy
load to finish for moving down to next computing stage.
Thus, how
to reasonably distribute the workload on each node is essential process
to get
best cluster performance. Currently, there are following
algorithms
developed to assign a proper workload to each processor,
- Data driven - Tasks are subdivided for each processing element in
a preprocessing step. Each processing element then works on it
assigned dataset. There is no communication between processing
elements.
- Demand driven - Tasks are finely subdivided. When a
processing element is finished processing one task, it is assigned
another. This continues until all tasks have been completed.
- Data parallel - The data itself is subdivided with each
processing element performing a task on a piece of the data.
Processing elements will have to communicate with each other in order
to access data not available to a particular processing element.
Data transmission
Variations of data replication are commonly used for networked
rendering
applications. However, low network throughput and large database
sizes
are the main problems which constrain the usability of every
possible
method. As the data has to be shipped to the user at some point,
this
problem is always present. Making the user wait for more than a
couple
minutes destroys immersion and makes many interactive applications
completely
useless. Furthermore, extended waiting periods mean that a
download
process cannot be invoked frequently, so exploratory behavior of 3-D
data spaces
becomes impossible. Currently, there are following approaches to
attack
this problem,
Software Approach
- Demand-Drive data transmission: Initial dataset is
organized into different objects or smaller dataset according to
client's request, only related dataset will be downloaded onto the
client side.
- Level of detail: At the request of client, an initial low
resolution image file which usually is a small dataset is downloaded
onto the client's side for rendering. When the client is viewing
coarse rendering result, a higher resolution image is being transmitted
to the client side for further rendering.
Hardware Approach
- Network data cache: A data block server, built using
low-cost commodity hardware components and custom software to provide
parallelism at the disk, server and network level such as Parallel
Storage System or DPSS. This technology has been quite successful
in providing an economical, high-performance, widely distributed, and
highly scalable architecture for caching large amounts of data that may
potentially be used by many different users. Current performance
result are 980 Mbps across a LAN and 570 Mbps across a WAN.
- A proliferation of high-speed, testbed network: There are
currently a number of Next Generation Internet networks whose goal is
to provide network speed of 100 or more times the current speed of the
Internet. These include NSF's Abilene, DARPA's supernet, and
ESnet testbeds. Sites connected to these networks typically have
WAN connection at speeds of OC12 (622 Mbps) or OC48 (2.4 Gbps); speeds
that are greater than most local area networks. Access to these
networks enables dramatically improved performance for remote,
distributed visualization.
References
Research Papers for More Information on This Topic
- Ian foster, Joseph Insley, Gregor von
Laszewski, Carl Kesslman and Marcus Thiebaux, "Distance Visualization:
Data Exploration on the Grid", "Computer, 1999", pp36
- Kengel, P. Hastreiter, B. Tomandl, K.
Eberhardt and T. Ertl, "Combining Local and Remote Visualization
Techniques for Interactive Volume Rendering in Medical Application",
"Proceedings of the conference on Visualization, 00"
- Jian Yang, Jiaoying Shi, Zhefan Jin
and Hui Zhang, "Design and Implementation of A Large-scale Hybrid
Distribute Graphics System", "Proceedings of the Fourth Eurographis
Workshop on Parallel Graphics and Visualization , 2002"
- Mark Coates, Rui Castro and Robert
Nowak, "Maximum Likelihood Network Topology Identification from
Edge-based Unicast Measurements", "ACM SIGMTRICS Performance Evaluation
Review, Proceeding of the 2002 ACM SIGMRYTICS international conference
on Measurement and modeling of computer systems"
- Wim Lamotte, Eddy Flerackers, Frank
VanReeth, Rae Earnshaw and Joao Mena De Matos, "Visinet: Collaborative
3D Visualization and VR over ATM Networks", "IEEE Computer Graphics and
Applications", pp 66-75
- Greg Humphreys, Ian Buck, Matthew
Eldridge and Pat Hanrahan, "Distributed Rendering for Scalable
Displays", "Proceedings of the 2000 ACM/IEEE conference on
Supercomputing"
- Kwan-Liu Ma David M. Camp, "High
Performance Visualization of Time-Varying Volume Data over a Wide-Area
Network", "Proceedings of the IEEE/ACM SC2000 Conference, 2000, pp.29
- Wes Bethel, Brian Tiernery, Jason Lee,
Dan Gunter and Stephen Lau, "Using High-Speed WANs and Network Data
Caches to Enable Remote and Distributed Visualization", "Proceedings of
the IEEE/ACM SC2000 Conference, 2000", pp. 28
- Gerd Hesina and Dieter Schmalstieg, "A
Network Architechture for Remote Rendering", "Second International
Workshop on Distributed Interactive Simulation and Real-Time
Application 1998, pp88"
- K.Engel, P. Hastreiter, B. Tomandl, K.
Eberhardt and T. Ertl, "Combining Local and Remote Visualization
Techinques for Interactive Volume Rendering in Medical Applications",
"Proceeding of the conference on Visualization '00"
- Neider J., Davis T., WOO M., OpenGL
Programming Guide- The Officicial Guide to Learning OpenGL,
Adison-Wesley Publishing Company (1993)
- Rost, J.Freiedberg, P. Nishimoto, PEX:
A Network-Transparent 3D Graphics System, Computer Graphics &
Applications Vol. 9, No. 4, pp. 14-26 (1989)
- De Floriani L., P. Marzano, E. Puppo,
Multiresolution Models for Topographic Surface Description, The Visual
Computer, Vol.12, No.7, Springer International, pp. 317-345 (August
1996)
- Macedonia M., M. Zyda, D. Partt, P.
Barham, S.Zeswitz, NPSNET: A Network Software Architecture for
Large-Scale Virtual Environment, Presence, Vol.3, No.4 pp. 265-287
(1994)
- Hardenberg J., G.Bell, M. Pesce, VRML:
Using 3D to surf the Web, SIGGRAPH'95 Course Notes, No.12 (1995)
Research Groups
- Lawrence Livermore National Laboratory's Display Wall
- Princeton's Scalable Display Wall
- Stanford's Interactive Mural
- UNC's PixelFlex System
Other Relavant Links
- Parallel Storage System: http://www-didc.lbl.gov/DPSS
- Abilene: http://www.internet2.edu/abilene
- Supernet: http://www.nji-supernet.org
- ESnet: http://www.es.net/
- National Transparent Optical Network: http://www.ntonc.org
- The Message Passing Interface (MPI) Standard: http://www.mcs.anl.gov/mpi
Scope
This
survey is based on electronic search in ACM's digital library, IEEE
Intracom proceeding, and their citations


